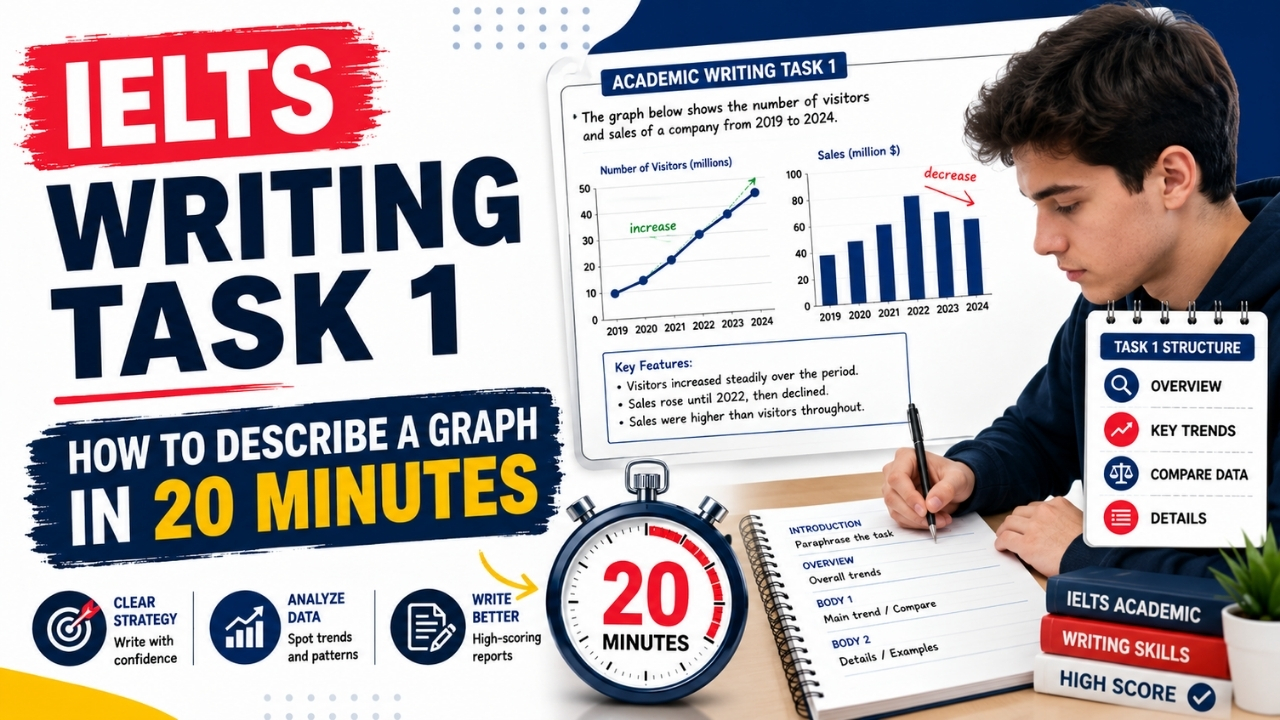
Academic Task 1 asks you to describe a chart, graph, table, map or process in about 150 words, in roughly 20 minutes. It’s worth less than Task 2, so the golden rule is simple: do it well, do it fast, and don’t let it steal time from the essay. Here’s a method that keeps you on track.
Spend two minutes reading the data
Before you write anything, understand what you’re looking at. What does the chart measure? What are the units — percentages, thousands, years? What’s the time frame? The most common Task 1 disaster is writing confidently about the wrong thing because you misread the axis. Two minutes of looking saves you from that.
Know the four-part shape
A strong Task 1 report has a predictable structure:
- Introduction (1 sentence). Paraphrase what the visual shows. Don’t copy the question — change the wording. “The graph illustrates…” becomes “The line graph shows changes in…”
- Overview (1–2 sentences). This is the most important part, and the one people forget. Step back and describe the big picture — the main trend, the highest and lowest points, the overall direction. Examiners specifically look for this; without a clear overview, your score is capped.
- Detail paragraph 1. Describe one group of data with specific figures.
- Detail paragraph 2. Describe the rest, again with real numbers.
Select, don’t list
You do not have to mention every single number. In fact, listing everything is a classic band-6 mistake. Your job is to select the important features — the biggest change, the peak, the point where two lines cross — and support them with data. Think of yourself as a guide pointing out the highlights, not a machine reading out a spreadsheet.
Use the right language for trends
This is where you can sound polished with very little effort. Learn a small set of trend words and rotate them: rose, increased, climbed, peaked, fell, declined, dropped, levelled off, remained stable, fluctuated. Pair them with adverbs — “rose sharply,” “fell slightly,” “increased steadily” — and you’ve covered most of what the test throws at you.
Don’t explain why
A surprising number of people lose marks by guessing at reasons: “Sales fell because of the economy.” You’re not told why, so don’t invent it. Task 1 is pure description. Save your opinions and analysis for Task 2.
A realistic finish
Write your 150-plus words, give it a 60-second check for tense and number slips, and then close the book on it. The discipline of stopping at 20 minutes is part of the skill. Practise enough timed Task 1s and the structure above becomes muscle memory — which is exactly what you want when the clock is running.